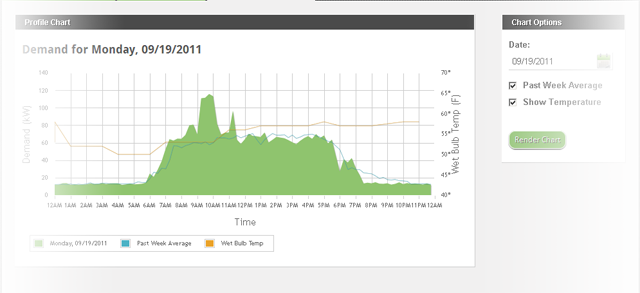
Demand Profiling
The data logger installed at your facility is capable of logging your demand at a 15 minute interval. By analyzing the system graphs for a given day, you are able to determine what equipment is causing spikes in demand.
Utility Bill Analysis
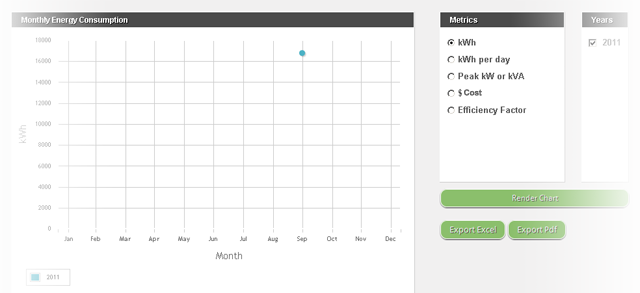
eConserve allows for the tracking of utility bill data. This can show line graphs to determine improvements and percent-change between different years for the metrics you choose.
It also offers advanced reporting capability.
Meter Monitoring
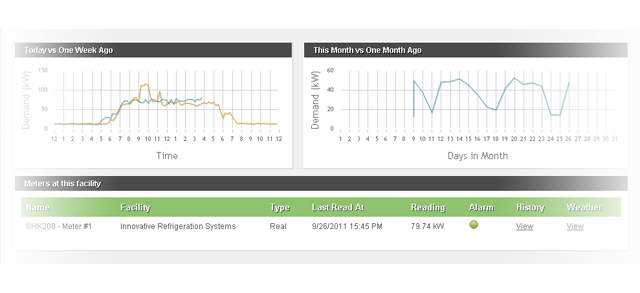
Our data loggers are able to capture all of your electrical systems raw data, enabling the software to create detailed reports and analyses of what is going on at your facility.
Weather Monitoring
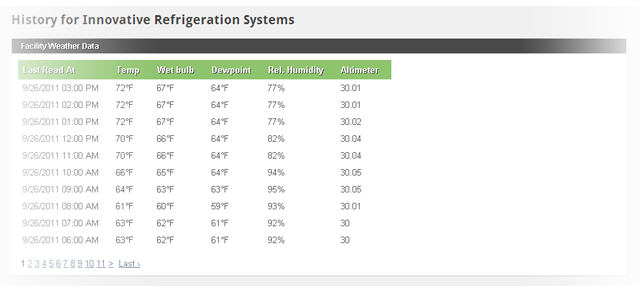
eConserve is suited to large plants where weather can play a large factor in energy usage. It is developed to record weather changes and normalize your data against these changes to create a normalized metric that can be used for fair data comparison.
Task Scheduling
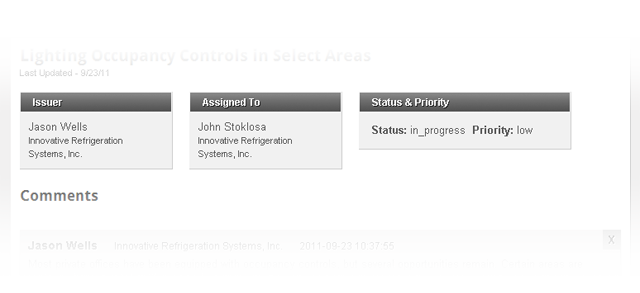
The Innovative team is here to help improve your plant. Our team of technicians can diagnose and recommend tune-ups and new equipment to make your building efficient and green. We know best practice in the refrigeration business and want to assist you with your energy savings programs.
Energy Trending
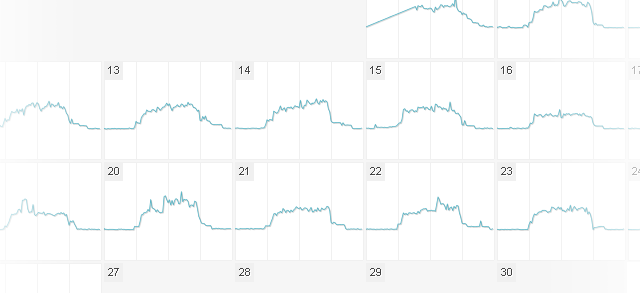
Day to day analysis can be a useful tool for spotting trends in a plants load profile. Enjoy month to month and day to day views in eConserve to ease the process of finding relationships in your operations.
Benchmarking
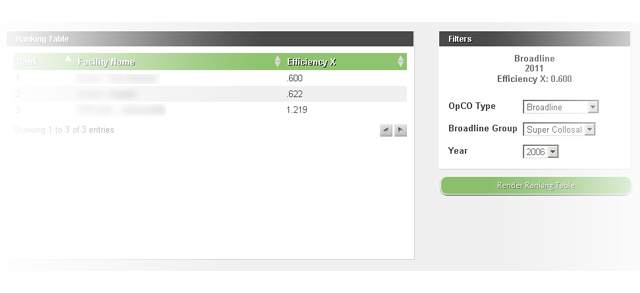
Arguably one of the most useful features of eConserve is benchmarking. eConserve generates weather normalized efficiency factors for each of your facilities, allowing you to identify which facilities are consuming the most energy and why. The software then ranks each of the facilities in order from least efficient to most efficient.
